3. Public Reallocations
Introduction
The government in National Transfer Accounts is an intermediary that mandates or directs the transfer of resources between age groups, receives and pays asset income, and accumulates public assets and liabilities or debt. The NT Flow Account distinguishes two categories of public sector transactions: public transfers and public asset-based reallocations.
Transfers refer to all economic flows that involve no quid pro quo. Transfers refer only to current transfers as distinct from capital transfers. Current transfers consist of in-kind transfers, equal to public consumption, and cash transfers.
Transfers consist of inflows to the beneficiaries of the program and outflows from taxpayers who are funding the program. Net transfers are measured as the sum of inflows (a positive value) and outflows (a negative value). Net transfers must sum to zero in aggregate, but can be positive or negative for any particular age group. This is true for each government function (education, health, etc.) and the public sector taken in total.
Transfer inflows are assigned to the age group of the intended beneficiary of the public programs in question. The inflows from public collective goods, e.g., national defense or diplomacy, are assigned on a per capita basis. Public transfer outflows are assigned to taxpayers based on tax incidence rules that are similar to those followed in Generational Accounting.
Public asset-based reallocations occur because taxpayers, through their government, can save and dis-save and can hold public assets and debt. Public asset-based reallocations are equal to public asset income less public saving. Examples of Public Asset Income are rent (payments for land and royalties for sub-soil minerals and fossil fuels) and net interest. Net interest is interest received on loans by the government to students, farmers, etc. less interest paid on public debt. Asset income is a net inflow for taxpayers if positive and a net outflow if negative. Public saving if positive generates an outflow from taxpayers while public dis-saving, or the accumulation of public debt, generates an inflow to taxpayers. It is important to understand the difference between saving/dis-saving and lending/borrowing in public accounts. Saving is the difference between income and consumption, while lending/borrowing is the difference between income and expenditure, i.e., consumption plus investment. When governments borrow to invest offsetting asset-based flows are generated – borrowing is an inflow and investing is an outflow. The net flow is zero.
A Simple Illustration.
A simple illustrative account illustrates important features of the public flow account, e.g., the connection between public transfers and public asset-based reallocations, and clarifies how the public sector fits into the overall accounts. The illustration emphasizes only selected key concepts and abstracts from other features of the public accounts discussed in more detail below.
In this simple illustration, there is no foreign sector and no capital and, hence, no investment. The government makes cash and in-kind transfers. The government taxes labor income and it can borrow from residents. There are three age groups – children, workers, and elderly. This is a consumption-loan economy similar to the one originally analyzed by Samuelson although there were no children in Samuelson’s model.
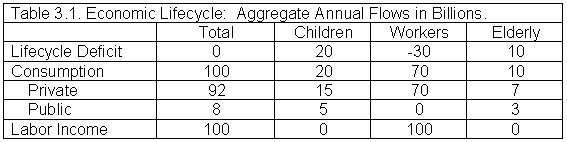
The economic lifecycle is shown in Table 3.1. Labor income for workers is 100 billion while children and the elderly have no labor income. Children consume 20, workers consume 70, and the elderly 10 billion with consumption split between public and private consumption as shown in the table. Consumption and labor income are equal in this special case because there is no capital or durables. Thus everything produced by the economy must be consumed in the current year. The economic lifecycle is summarized by the lifecycle deficit. Children and the elderly have deficits of 20 billion and 10 billion, respectively, while workers have a surplus of 30 billion.
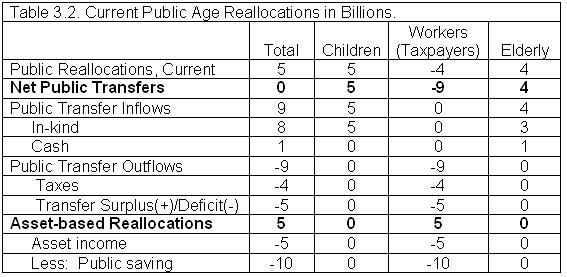
Current public sector reallocations are documented in Table 3.2. Children and the elderly received 5 billion and 4 billion in public transfers, respectively. The children received 5 billion in in-kind public transfers (education), while the elderly received 3 billion in in-kind transfers (health care) and 1 billion in cash transfers (pensions).
The public transfer inflows were matched by 9 billion in public transfer outflows from worker (taxpayers). Public transfer outflows consisted of 4 billion in taxes levied on labor income, leaving a deficit of 5 billion to be met through public asset-based reallocations. Some countries have positive asset income that can be used to offset a portion or all of the transfer deficit, but this is not the case here. Asset income is negative because the country has substantial debt. Hence, its asset income (interest payments of 5 billion) is negative. Thus, taxpayers borrow 10 billion during the period to cover the deficit in the public transfer sector (- 5 billion) and to pay 5 billion in interest expense.
To complete the picture private sector age reallocations for this simple economy are shown in Table 3.3. Current private transfers are limited to transfers from parents to their children of 15 billion. The elderly generate 6 billion in inflows through asset-based reallocations – 1 billion in asset income and 5 billion through dis-saving. The elderly sell
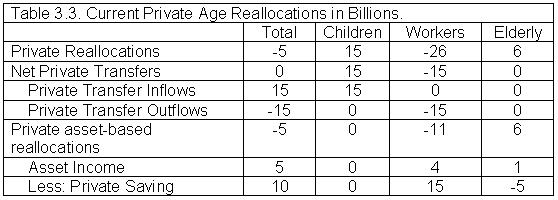
government securities worth 5 billion to workers. The workers experience an outflow of 11 billion through asset-based reallocations. Their 4 billion in asset income (an inflow) is offset by 15 billion in saving – 5 billion in securities acquired from the elderly and 10 billion in newly issued government securities. An important feature of financial assets is apparent in the flow account. The debt of the public sector is an asset of the private sector. Hence, public asset income of –5 billion is matched by private asset income of +5 billion. Likewise, public saving of –10 billion is matched by private saving of +10 billion.
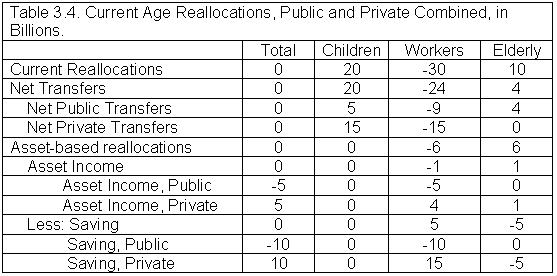
Public and private reallocations are combined in Table 3.4. Reallocations at each age are equal to the lifecycle deficit satisfying the flow constraint, equation (2). The lifecycle deficit of children is met through transfers. The lifecycle deficit of the elderly is met in part through transfers and in part through asset-based reallocations. Important features of financial transactions are apparent in Table 3.4. Financial asset income must sum to zero. One age group’s financial asset income inflow is another age group’s financial asset income outflow. Likewise, the accumulation of financial assets is always equal to the accumulation of financial liabilities. Hence, one age group can dispose of a financial asset if another age group acquires it. In the more general case, of course, assets can be sold or acquired from the rest of the world.
The following sections provide a more complete and detailed explanation of the public sector accounts.
Aggregate Values and the Structure of Public Flows
The Structure of Public Flow Account (Table 3.5) provides a quantitative overview of the public sector. In NTA the public sector has two broad functions. First, it mediates transfers to program beneficiaries from taxpayers. This function is summarized under “Public Transfers”. Beneficiaries receive Public Transfer Inflows which consist of In-kind Transfers and Cash Transfers. Public Transfer Outflows include Taxes and Grants which are all payments to the government from residents and the rest of the world. This includes taxes, social contributions, current grants from foreign governments, and a portion of other revenues of the government.
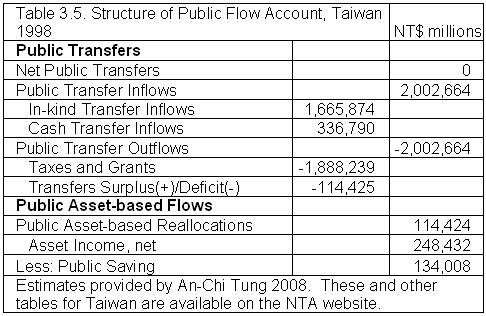
Net Public Transfers must sum to zero by definition. The Transfer Surplus/Deficit, unique to NTA, is a balancing item that holds because transfer outflows and inflows must be equal. If in deficit, the government must rely on public asset-based flows to generate resources needed to fund its transfer programs. A transfer surplus is matched by asset-based outflows in the form of negative asset income or public saving.
The second function of the public sector is to manage public assets, which produce two flows. The first flow is public asset income. This includes all income from financial asset and liabilities and income from non-financial assets owned by the public sector.
Interest expense on public debt is a component of public asset income – with a negative value. The second asset-based flow is public saving. Public saving must equal the sum of the Transfer Surplus/Deficit and asset income. If taxes and grants exceed public transfer inflows, the transfer surplus and asset income are saved. If taxes and grants fall short of public transfer inflows, the transfer deficit must be financed out of asset income with the residual saved. If asset income is insufficient, the shortfall is met through public dis-saving.
Public Transfers
Click on the link for detailed discussion of 3.1 Public Transfers
Public Asset-Based Reallocations
Click on the link for detailed discussion of 3.2 Public Asset-Based Reallocations
-- Back to Table of Contents