4.2 Private Asset-Based Reallocations
Introduction
The final component of the NT Flow Account to be estimated is private asset-based reallocations. These estimates cannot be completed if transfers and public asset-based reallocations have not been estimated. The methods described here conform to the asset reallocation spreadsheet (RA.xls) that can be used to estimate both public and private asset-based reallocations.
The existence of assets provides an important mechanism for shifting economic resources across age. Young adults may generate resources by acquiring debt. In the U.S. this is a common means by which college students pay for part of their education. Working-age adults may save to buy a house, to pay for the education of their children, and to fund their retirement. Older adults may depend on pension funds and personal saving to fund their retirement needs. Each of these is an example of using asset-based reallocations to deal with a basic feature of the lifecycle, namely, that the path of individual labor income does not conform with the preferred path of individual consumption.
Individuals may accumulate, acquire, and hold assets for other reasons. Some may accumulate wealth to protect themselves from unforeseen events, to leave a bequest to their children, to support charitable activities, or for other reasons. Some individuals may receive inheritances by pure chance. Although the motives that lead to the accumulation of assets are an important research issue, the methods for measuring the flows in NTA are entirely independent of motive.
Asset-based reallocations are the composite of two flows: asset income and saving. In NTA two kinds of asset income are distinguished: capital income and property income. Capital income is the return to capital held by corporations and households. All capital income accrues to domestic sectors and with minor exceptions to private domestic sectors (corporations and households). Public enterprise is considered to be part of the private (or enterprise) sector as in National Income Accounts.
Property income arises because of the existence of financial assets, e.g., debt instruments and corporate shares. Important forms of property income are interest, dividend and rent (payments to owners of land, fossil fuels, and other subsoil minerals). For any form of property income inflows and outflows must always balance. Interest paid by debtors must equal interest received by creditors, dividends paid by corporations must equal dividends received by shareholders, and so forth.
Financial assets and property income play several important roles in age reallocations and in NTA. First, consumers may rely on private credit to fund their lifecycle deficits generating private interest income and expense. Second, individuals and governments may engage in credit transactions leading to private interest flows with public counterpart interest flows. Government debt, for example, generates private interest inflows and public interest outflows. Third, private institutions and foreign institutions may engage in financial transactions. ROW may extend credit to domestic parties or may own shares in domestic corporations generating interest flows or dividends.
Many financial assets and the associated flows do not lead to age reallocations in NTA. A transactions between domestic firms is an example. If a bank extends credit to a corporation, for example, no net age reallocations are generated. The associated age-specific inflows and outflows balance.
The second major component of asset-based reallocations is saving. Individuals can accumulate debt or dispose of existing assets to generate inflows. Or individuals can dispose of debt or acquire assets generating outflows.
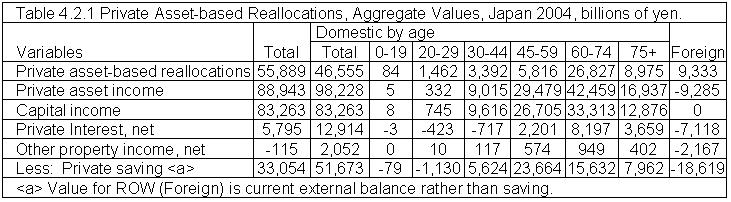
Asset-based reallocations are illustrated in Table 4.2.1 using estimates for Japan 2004 (Ogawa et al. 2008). Total private asset income amounted to 98.2 trillion yen and total net private saving was 51.7 trillion yen. The difference, 46.6 trillion yen, is equal to total asset-based reallocations. The values are reported for broad age groups here, based on estimates for single years of age with 90+ the upper age category. Because all asset income and saving are classified by age of the household head, the values for children are zero and for late teens are very small. In Japan asset-based reallocations are largest for the 60-74 and 75+ age groups. Private asset income for the 45-59 age group is substantial, but saving is 80% of asset income. In contrast, for the 60-74 age group saving is 37% of asset income and for the 75+ age group saving is 47% of asset income. There are many additional interesting features of the private asset-based reallocations in Japan not explored here.
Private Asset Income
Private asset income consists of capital income plus net property income for households, corporations, and non-profit institutions serving households (NPISHs), all sectors distinguished in national income accounts (financial and non-financial corporations are also often distinguished). Capital income is the return to private sector capital and includes the operating surplus of corporations, public enterprise, and NPISHs, the operating surplus of the household sector, and the portion of mixed income of the household sector that is estimated to be a return to capital. NTA estimates are based on the assumption that 1/3 of mixed income is a return to capital and 2/3 is a return to labor. The operating surplus of the corporate sectors is measured as the difference between revenues and operating costs. The operating surplus of the household sector is the capital income that arises from owner-occupied housing. Capital income is computed inclusive of taxes on production less subsidies.
Only a portion of the capital income that flows to institutions within the economy are retained by those institutions. Capital income is distributed to institutions and individuals that have provided the capital. Corporations, for example, distribute earnings to its share holders by paying dividends, to its creditors by paying interest, and to owners of land, fossil fuels, and sub-soil minerals by paying rent. These distributions are components of property income.
Property income consists of dividends, interest, and rent or variations on these economic forms. Property income does not consist only of capital income distributions. Households also accumulate consumer debt, and interest inflows and outflows that arise as a consequence are property income. Private property income also includes interest income on public debt, a public asset income outflow, paid to the private sector, a private asset income inflow. And private property income includes flows from the ROW that will be positive if residents are net owners of foreign assets or negative if foreigners are net owners of domestic assets.
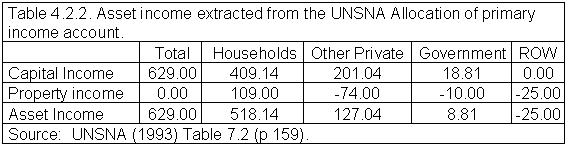
The flows of asset income are illustrated in Table 4.2.2 using values based on the Allocation of Primary Income Account in UNSNA (1993). Values for the “Other Private” sector are computed by combining the flows for financial and non-financial corporations and NPISHs. About two-thirds of capital income accrued directly to households and about one-third accrued directly to “Other private”, predominantly corporations. The capital income of government is relatively minor and not of concern here. By definition, capital income for ROW is zero.
Asset income of the household sector is substantially greater than its capital income primarily because corporations are paying dividends, interest, and rent to the household sector and because the government is paying interest either directly to the household sector or indirectly to the household sector through corporations. A significant portion of asset income may not be distributed to the household sector, because it is retained by corporations.
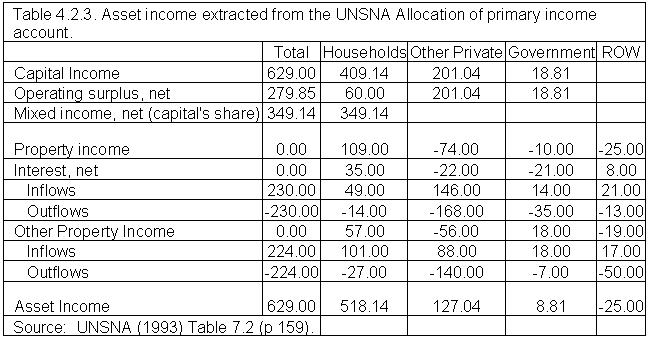
Additional detail about asset income, again extracted from the UNSNA Allocation of Primary Income Account, is shown in Table 4.2.3. The components of capital income – operating surplus net of depreciation, capital’s share of mixed income net of depreciation, and taxes on production net of subsidies – are reported. Capital income in NTA is the pre-tax value. The method for estimating the share of taxes on production net of subsidies born by capital is discussed elsewhere.
Property income is reported separately as interest and other property income in Table 4.2.3. In UNSNA property income consists of interest; distributed income of corporations; reinvested earnings on direct foreign investment; property income attributed to insurance policy holders; and rent. The components of property income can be treated separately, but the same methods are used to allocate each of these components except interest income. Here, we distinguish only interest income and other property income.
The calculation of interest inflows makes an important distinction between different forms of credit. One form of interest arises because of consumer credit which, in principle, consists of loans undertaken by households to fund consumption. Interest on consumer credit has no exact counterpart in SNA, and hence NTA employs a broader measure of interest outflows – interest paid by households. This measure is a composite that includes interest paid on consumer goods, home mortgages, and debt incurred by family businesses.
Property income, interest or other property income, leads to age reallocations because of financial transactions between the public sector and the private sector. The public sector may extend credit to private individuals who, for example, participate in student loan programs or farm loan programs. If so, the result will be a private interest outflow. The private sector may extend credit to governments to finance public debt. If so, the result will be a private interest inflow. Public ownership of firms, land, and sub-soil minerals will also lead to flows in the form of property income which influence the age distribution of income.
In a similar fashion, financial transactions between private domestic units and the rest of the world (ROW) will lead to property income flows which influence the age distribution of asset income. For example, individuals may shift resources from younger to older ages through foreign investment leading to an outflow at young ages and inflows in the form of property income and/or dis-saving at older ages.
Financial transactions between firms do not have any clear effects on the age profile of asset income. If, for example, businesses extend credit to other businesses, property income outflows and property income inflows will be larger at each age, but the net flow of asset income will be zero. It is assumed that the age profile of the owners of corporations with property income inflows and the age profile of the owners of corporations with property income outflows are identical in shape. Note that property income flows between corporations will be non-zero to the extent that the flows are between corporation and the government or ROW.
A complete accounting of inter-sectoral interest flows may be available for some countries. In many cases, however, this information is unavailable. In these instances, estimates of inter-sectoral flows are made using methods described below.
Calculation of Public and Private Interest
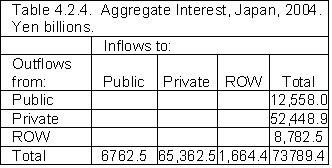
The interest flow matrix is presented in Table 4.2.4. Inflows and outflows for each sector are known (the row and column totals), but the flows between sectors are not known. Here and in the tables below outflows are reported as positive values. The methods are illustrated using values for Japan 2004 (Ogawa et al. 2008).
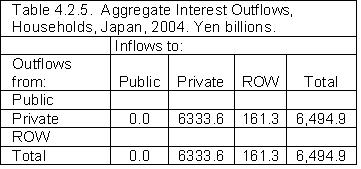
Household interest outflows are reported in Table 4.2.5. The total outflow is known from SNA. Outflows from households must be matched by inflows to public, private, or ROW sectors. Interest payments by households to governments are assumed to be available from administrative records. Here it has been assumed that interest payments by Japanese households to the government are 0. The remainder is allocated between private and ROW in proportion to total inflows reported in Table 4.2.4.
Interest flows excluding interest outflows from households are reported in Table 4.2.6.
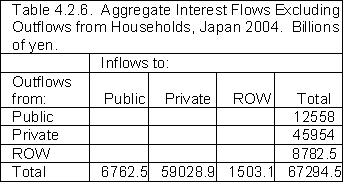
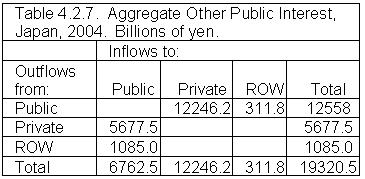
Table 4.2.5 considers only interest flows from households to the public sector. Other interest flows involving the public sector are treated in Table 4.2.7. Public interest outflows are allocated between private and ROW in proportion to the inflows to those sectors in Table 4.2.6. Likewise public interest inflows not treated in Table 4.2.5 are allocated to the private and ROW sectors in proportion to the outflows from those sectors reported in Table 4.2.6.
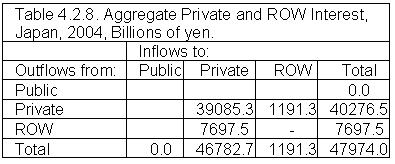
The final private interest flows are treated in Table 4.2.8. These flows consist of interest paid by the private sector to other private institutions and ROW and interest received by private institutions from private institutions and ROW. The values in Table 4.2.8 are calculated as residuals.
Allocating Asset Income by Age
The methods for allocating asset income by age require a comprehensive income and expenditure survey with the following information:
- Property income (interest income, dividends, and rent);
- Mixed income (income from a business, farm, self-employment income, etc.)
- Imputed rent from owner-occupied housing;
- Interest expense;
- Household roster with the age of the head.
In NTA assets and asset income are assigned to the age group of the household head. Except in rare cases data are not available on individual ownership of assets or asset income within the household. In the absence of such information, assigning assets or asset income to individuals is impractical.
Private capital income consists of three components identified above: (1) the net operating surplus of households; (2) capital’s share of mixed income of households; and (3) the net operating surplus of corporations and NPISHs.
The net operating surplus of households is the return to capital on owner-occupied housing. Its age profile is estimated by the age profile of imputed rent from owner-occupied housing.
The age profile of capital’s share of net mixed income of households is estimated by the mixed income of the household. The split of mixed income between capital and labor is thus assumed to be independent of the age of the household head.
The age profile of the net operating surplus of corporations and NPISHs is assumed to be proportional to the age profile of property income of the household. Thus, the undistributed operating surplus of corporations is assumed to have the same age profile as the distributed operating surplus of corporations (Table 4.2.9).
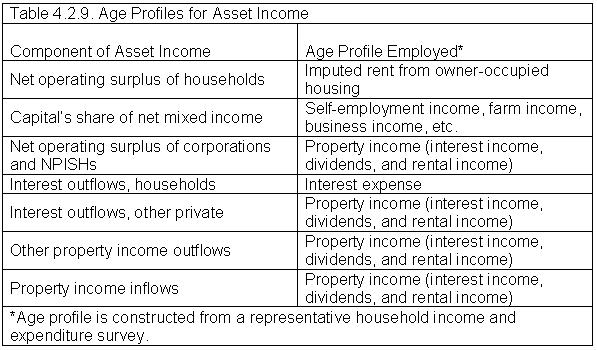
The age profile of interest outflows for households is estimated by the age profile of interest expense.
The age profiles of Other private interest outflows, Other property income outflows, and Property income inflows are assumed to be proportional to the age profile of property income. This requires some explanation. These outflows are dominated by flows from firms, not from consumers, such as interest and dividend payments by corporations. Thus, the appropriate age profile for these flows is the age profile of property income used as a proxy for credit and equity interests held in corporations. The implication of this approach can be seen in the case where all capital income of corporations is distributed to the individuals who own shares or who have extended credit to the corporate sector. The capital income of corporations, the property income outflows from those corporations, and the property income inflows to households (individuals) would all have the age profile of property income. The net flow to individuals would be the property income inflows which would be identical to the capital income of the corporate sector.
Interest inflows are assumed to have the same profiles as other property income. Hence, credit extended to the household sector results in age reallocations. For example, if young adults accumulate consumer debt, the age profile of interest outflows will be younger than the age profile of interest inflows for household credit. In contrast interest flows within the corporate sector do not result in age reallocations.
Private Saving
Private saving is the final balancing item in National Transfer Accounts. At each age, reallocations must equal the lifecycle deficit. Age reallocations in turn must equal net transfers plus public asset-based reallocations plus private asset-based reallocations. Private asset-based reallocations are equal to private asset income less private saving. Hence,
Private saving = Lifecycle deficit – transfers – public asset-based reallocations – private asset income.
This identity holds at each age. Total private saving, thus calculated, must equal net private saving as calculated in NIPA.
Illustrations
The illustrative values presented here should not be taken as a standard or model to which other countries conform. Values may vary widely from country to country. These estimates were constructed by the research team at Nihon University Population Research Institute (Ogawa et al. 2008). The estimates are preliminary and subject to revision. The most recent estimates are available on the NTA website.
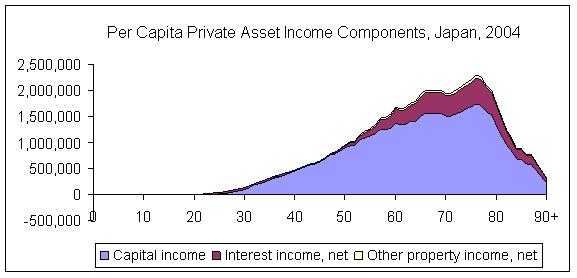
Private asset income consists of capital income plus property income. In Japan, asset income increases steadily with age and peaks in the late 70s. Capital income is the most important component of asset income. Net private interest income is also quite important in Japan, while net property income other than interest is quite small.
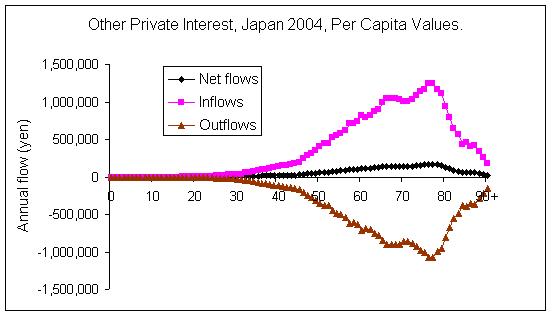
Interest
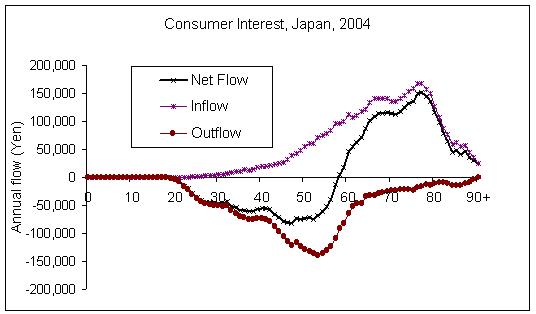
Consumer interest as it is used here is interest paid by households and encompasses interest on all household debt including consumer debt, housing debt, or business debt. The flows in Japan are strongly upward. Interest outflows peak for those in their 50s and are quite small for those in their 60s. Interest inflows follow the property income profile for Japan which is heavily concentrated at older ages.
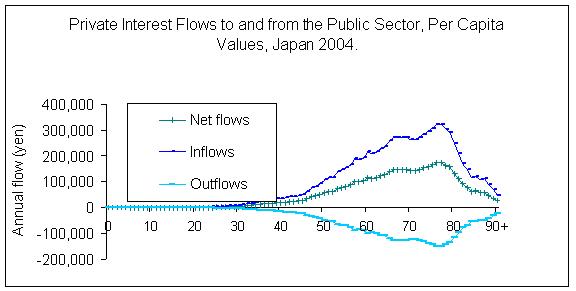
Private interest flows to and from the public sector are shown in the next figure. The shape of the age profile of the inflows and the outflows are identical. The inflows to the private sector exceed the outflows (Japan has a large public debt), thus net private flows are positive and accrue to older Japanese.
The final component of private interest is composed of flows between private institutions and between private institutions and ROW excluding consumer credit. In a closed economy these flows would net to zero both in aggregate and for each age because the age profiles for the outflows and the inflows are identical. In the case of Japan, the interest inflows exceed interest outflows because interest inflows from ROW exceed interest outflows to ROW. The result is a net inflow primarily to older Japanese.
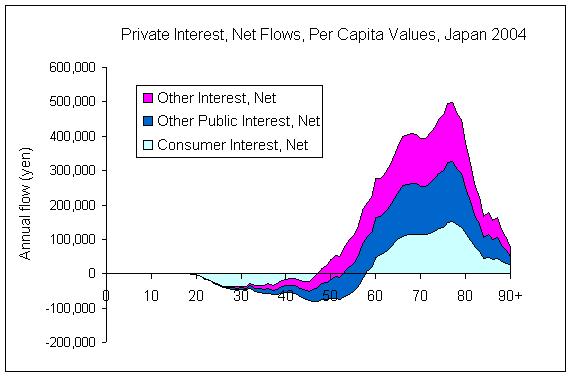
Net private interest flows are combined below. The net combined inflows turn positive in the late 40s and are very large at older ages. No single source dominates: consumer credit, net interest from the public sector, and net interest from ROW all play a role.
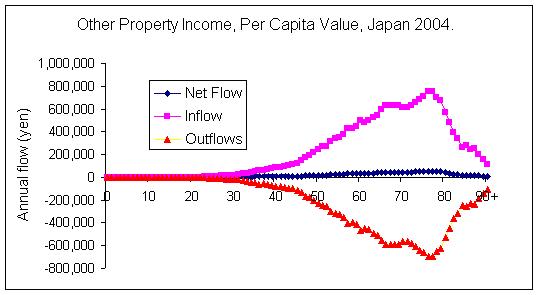
Property income other than interest
Property income other than interest includes dividends, rent, and similar financial flows. The age profile of property income for the household is used to represent all of these flows. The net flows arise because of flows between the private and public sector and between the private sector and ROW. Net private property income other than interest is very small in Japan as compared with other forms of asset income.
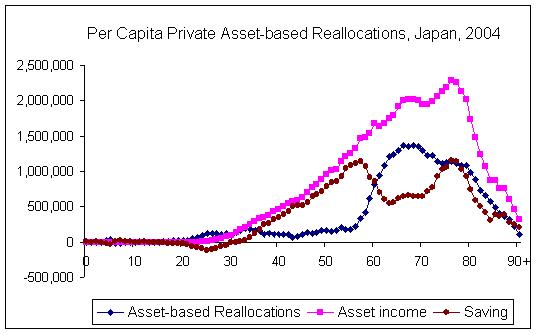
Per Capita Private Asset-based Reallocations
Young adults in Japan are dis-saving and saving does not turn positive until around age 30 (in the cross-section). Asset income exceeds saving at these ages. Saving and asset income both rise steeply for those between their mid-thirties and late fifties. Over this age range, almost all asset income is saved but nothing more. Private asset-based reallocations are never negative, but they are small until the late 50s. There is a striking dip in saving and a corresponding increase in asset-based reallocations for those in their 60s and early 70s. Saving, asset income, and asset-based reallocations all decline beginning in the late 70s and continuing through the 80s.
-- Go to next page 5. Appendix
-- Back to Table of Contents